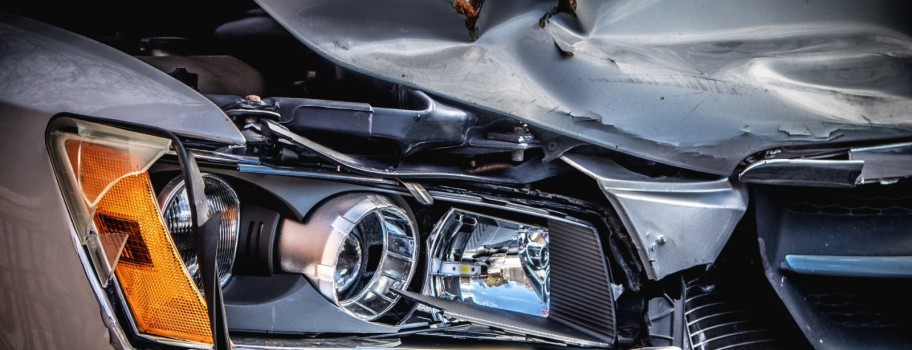

There are approximately 6 million car accidents in the US each year. Nearly half of car accidents are caused by aggressive drivers, with 23% of all crashes resulting in injury and 37% fatal. The US has twice the number of deaths as 19 other high-income countries, with 90 people dying per day. The driving statistics will floor you, and this article will take you down the road to learning more about speeding, road rage, age-related stats, plus which country has the most car accidents.
Article Contents
- Car Accident Deaths Per Year: How Many People Die in Car Accidents in the US?
- Car Accident Statistics: How Many Accidents Per Year?
- Aggressive Driving Statistics: How Many Auto Crashes Involve Aggressive Behavior?
- Car Accidents By Country: What Country Has the Most Car Accidents?
- Speeding Statistics: How Many Accidents Are Caused by Speeding?
- Car Accident Statistics by Age: Motor Vehicle Crashes are the Leading Cause of Death for What Age Group?
As we merrily drive down the road on a leisurely Sunday afternoon or a commute to and from work, people don’t realize the danger of accidents and deaths on the road. If they were aware, they might take it easy and follow speed limits.
These top driving statistics offer everything you need to know. Hopefully, the facts will slow you down and help you make informed decisions about reducing your risks and make you a safer driver. Let's drive on through the figures that will make your tires screech!
Car Accident Deaths per Year Worldwide | How Many People Die in Car Accidents in the US?
There are approximately 1.35 million car accident deaths per year worldwide that involve automobiles, motorcycles, bicycles, trucks, or pedestrians. That’s an average of 3,700 deaths per day worldwide. 7% of all automobile car crashes worldwide are fatal. More than half of all fatalities are pedestrians, motorcyclists, or cyclists.
Of the 6 million car accidents in total, there are 38,000 automobile deaths per year in the US. This works out to an average of 6% of all car accidents in the US are fatal or 104 deaths each day. The rate of deaths per day in the USA is 12.4 deaths per 100,000 people, or 1.13 deaths per 100,000 miles traveled. The US is twice the average rate of traffic deaths than 19 other high-income countries in Western Europe, Canada, Australia, and Japan.
Key Statistics:
- 1.35 million vehicle deaths per year worldwide
- 4.4 million are seriously injured and require medical attention in addition to the deaths
- 3,700 car accident deaths per day worldwide on average
- 38,000 car crash deaths per year on average in the US
- 104 car accident deaths per day on average in the US
- 12.4 deaths per 100,000 people = rate of car accident deaths per capita in the US
- 1.13 deaths per 100,000 miles traveled = rate of accident deaths per miles in the US
- 53% percent of car fatalities in 2018 occurred in single-vehicle crashes
- 37% of all fatal car wrecks involving trucks occurred between 6 PM and 6 AM
- The US has 2x the rate of car accident deaths compared with 19 other high-income countries
- There were 36,560 traffic deaths in 2018, which is a 2.4% decrease in car accident deaths despite an increase of .03% more people driving more miles
- 3,000 traffic deaths from collisions occurred in Florida in 2016
- The range of death rate per 100 million miles traveled is 0.54 in Massachusetts to 1.83 in South Carolina
- The District of Columbia fatality rate per 100,000 people is 22.2
- The Mississippi fatality rate per 100,000 people is 4.4
- Montana, at 71%, has the highest percentage of deaths in a single-vehicle accident
- Nebraska, at 57%, has the highest percentage of deaths in multiple-vehicle crashes
Sources:
https://driving-tests.org/driving-statistics/
https://en.wikipedia.org/wiki/Motor_vehicle_fatality_rate_in_U.S._by_year
https://www.anidjarlevine.com/fort-lauderdale-personal-injury-lawyer/what-percentage-of-car-accidents-are-fatal/
https://www.asirt.org/safe-travel/road-safety-facts/
https://www.cdc.gov/injury/features/global-road-safety/index.html
https://www.cdc.gov/publichealthgateway/didyouknow/topic/vehicle.html
https://www.driverknowledge.com/car-accident-statistics/
https://www.iihs.org/topics/fatality-statistics/detail/state-by-state
https://www.nsc.org/road-safety/safety-topics/fatality-estimates
https://www.thewanderingrv.com/car-accident-statistics/
https://www.iihs.org/topics/fatality-statistics/detail/state-by-state
Car Accident Statistics | How Many Car Accidents per Year?
Car accident statistics indicate that the number of car accidents per year is between 20 and 50 million people worldwide. There are 6 million car accidents per year on U.S. roadways. So doing the math, how many car accidents happen a day? A whopping 16,428 per day in the US occur. How’s that for sobering car accident statistics?
Additional Car Accident Statistics:
- 6 million US car accidents per year
- 16,438 US car accidents per day
- 20 - 50 million people worldwide suffer injuries that require medical attention from car accidents
- 27% of car accidents result in non-fatal injuries
- 3 million people in the US suffer injuries that require medical attention in U.S.
- 22,471 US accidents per year cause property caused only property damage
Sources:
https://www.who.int/news-room/fact-sheets/detail/road-traffic-injuries
https://en.wikipedia.org/wiki/Motor_vehicle_fatality_rate_in_U.S._by_year
https://www.asirt.org/safe-travel/road-safety-facts/
https://www.iihs.org/topics/fatality-statistics/detail/state-by-state
https://www.thewanderingrv.com/car-accident-statistics/
https://www.driverknowledge.com/car-accident-statistics/
https://www.safetyinsurance.com/driversafety/tips_statistics.html
https://www.sweeneymerrigan.com/car-accident-statistics-in-the-united-states/
https://www.iii.org/fact-statistic/facts-statistics-highway-safety
Aggressive Driving Statistics: How Many Auto Crashes Involve Aggressive Behaviors?
According to national statistics, 106,727 fatal automobile accidents involved aggressive behaviors during a recent four-year analysis per AAA Foundation for Traffic Safety. That’s over 50 percent (55.7% to be exact) of all fatal crashes are caused by aggressive driving! Speeding is the biggest offender, and also, road rage is an aggressive driving problem. We’ll delve into the speeding statistics in a moment, but first, “what is road rage?”
Road Rage Definition: aggressive, angry, threatening behavior exhibited by drivers on the road. Road rage can mean different things under different circumstances, but generally, road rage is an incident where the driver slings verbal insults, manifests physical threats or makes dangerous and precarious driving movements intended to intimidate another driver or even pedestrian or bicyclist.
What is the cause of road rage? Mishandled stress and frustration can cause a driver to lose control. Often, road conditions such as heavy traffic, sitting at stoplights, parking, waiting for passengers can elicit symptoms. It’s often perceived aggressions (whether intentional or not) or personal situations like running late that are causes of road rage. That quickly lead to retaliation and escalation. Sadly, road rage is a learned behavior, and many retaliate or escalate when they see others doing it.
Road Rage Statistics:
- 55.7% of all fatal crashes are caused by aggressive driving
- 80% of people have engaged in aggressive driving behavior in the last year
- 47% of drivers have yelled
- 45% have leaned on their horns
- 33% made offensive gestures
- 44% of road rage was prompted by getting cut off
- 37% of road rage involves deadly firearms
- Approximately 30 murders are prompted by road rage in the US per year
Who Are the Most Aggressive Drivers?
Road rage is more rampant than you might think. 80% of all drivers in the US have been involved in some form of road rage in the last year. In 2020, of the 95 million drivers on the road, nearly half or 47% have actually yelled at another while driving. 45% have leaned on their horns and honked to express frustration and anger. 33% have made offensive gestures.
Men age 18-21 are the biggest offenders of aggressive driving
The millennial driver accounts for about 51% of incidents
On the flip side, 39% of male drivers have been the target of road rage, while 28% of female drivers have been victims
Source: https://mattsharplaw.com/news/road-rage-facts/
What Are the Financial Consequences of Aggressive Driving?
Aside from the tragic cost of life and limb, there is a financial cost to aggressive driving.
Road and highway crashes cost the United States approximately $150.5 billion per year. Of that total amount, it’s estimated that ⅓ of crashes and ⅔ of fatal car wrecks are caused by aggressive driving. Road rage is exempted in most auto insurance policies, which means there is zero coverage for perpetrators.
Source: https://one.nhtsa.gov/nhtsa/announce/testimony/aggres2.html
Car Accidents by Country: What is the Country with Most Car Accidents?
When looking at car accidents by country, Libya in Africa tops the list with the world's most car accidents. The Eastern Mediterranean and specifically Saudi Arabia car accident statistics rank second. The Western Pacific and Southeast Asia rank third and fourth, with China having the following highest number. The Americas rank fifth, with Europe having the least number of accidents.
Low and middle-income countries account for more than 90% of the world’s crash deaths and a death rate 3x higher than high-income countries. The traffic fatalities by country are shown below:

Source: https://www.statista.com/chart/4394/the-worst-countries-for-road-traffic-fatalities/
Key Statistics:
- Libya’s death rate of 73.4 deaths per 100,000 people makes them the country with the most car accidents
- Saudi Arabia’s death rate of 34.57 per 100,000 ranks them at #32
- Saudi Arabia’s total deaths per year are 9,112, which is 8.75% of all deaths in the country
- China accidents are growing year over year, and in 2018, 63,194 traffic deaths occurred while 257,532 people were wounded or injured
- Car accidents are the most significant cause of death in China
- 90% of fatal car crashes occur in low and medium-income countries
- Low and middle-income countries have 3x the death rate as high-income countries
- There are financial consequences to car accidents and injuries, particularly in low and middle-income countries where costs are approaching $100 billion.
Speeding Statistics: How Many Accidents Are Caused by Speeding?
Nearly 10,000 accidents per year are caused by speeding. The reason why speeding is dangerous is that excessive speed is a factor in 26% of all traffic fatalities. For drivers involved in fatal crashes, young males are the most likely to be speeding. The relative proportion of speeding-related crashes to all crashes decreases with increasing driver age. In 2004, 38 percent of the male drivers age 15 to 20 who were involved in fatal crashes were speeding at the time of the crash. The most common aggressive driving action that contributed to accidents is speeding.
Car Accident Statistics by Age | Motor Vehicle Crashes are the Leading Cause of Death for What Age Group?
Road crashes are the leading cause of death in the U.S. for people aged 1-54.
Road traffic injuries are the leading cause of death for children and young adults aged 5-29.
Nationwide, 43 percent of first-year drivers and 37 percent of second-year drivers are involved in car crashes. Advanced Driver Training has reduced that rate to 4.6 percent of first-year drivers, as determined in a four-year study.
Cover Photo Credit: Clark Van der Beken